
It is sometimes claimed that Don Bradman owed much of his batting success to favourable conditions unknown in the modern era. The type that prompted Neville Cardus to describe Trent Bridge as “a lotus land for batsmen, a place where it was always afternoon and 360 for two wickets.”
The inference is that Bradman would have been less successful in any subsequent era. Which begs two questions. How prolific would Bradman be today ? And would any modern batter, finding himself in the 1930s, have matched his record?
As none of us witnessed cricket prior to the 1950s, our responses can only be based on raw figures and subjective reports. And as I proposed last year in Selecting All-Time cricket XIs: A guide on how to rank Test batters from different eras, statistics are a very blunt instrument with which to compare eras.
Nevertheless I will test the claim, by comparing decades 60 years apart- the Ashes contests of the 1930s and 2000s. Each encompassed five series. Both nations were competitive, and won series. Sides were always at full strength. The same grounds were used. And every Roarer aged over 40 witnessed the 2000s matches.
The Ashes in the 1930s
The decade began at Trent Bridge with a rain-affected, low-scoring match. It ended at The Oval with one side batting for 336 overs to score 7(dec)903.
In Australia every game continued for as long as it took to achieve a result. In England the same format applied to any series decider, while every other match was allocated four days. Over-rates were high, and scoring rates low. Captains resisted using physical intimidation – with one notable exception.
While pitches were prepared to last, protecting them from the elements was prohibited. And when they were rain-affected, they were played on.
The Ashes in the 2000s
The decade began at Edgbaston with three individual centuries in a team score of 576. It ended at The Oval with one side setting a 546-run target by galloping to 9(dec)373 at 3.92 runs per over.
Each match featured five days’ play, no rest day, and 90-over daily quotas. Pitches were fully covered, and to play on a rain-affected one was unthinkable. Advanced drainage systems quickly removed any unintended pitch moisture.
Batsmen faced pace batteries, and fielding sides didn’t carry passengers. As some compensation batters wore protective equipment, and brandished more powerful bats. In addition, outfields were faster and boundaries closer.
Team totals
A team scored in excess of 500 runs 11 times during the 1930s, and 9 times in the 2000s. The average runs per wicket was 35.31 during the 1930s, and 35.16 in the 2000s, a difference equivalent to just 1.7 runs per team innings.
The median team score, or the total reached in half of all innings, is another useful comparison tool. It was 323 during the 1930s, and 325 in the 2000s.
A comparison of batting top-orders yields virtually-identical figures. The median score at the loss of a side’s fifth wicket was 190 during the 1930s, and 191 in the 2000s. And the average partnership for any of a side’s first 5 wickets was 44.62 during the 1930s, and 42.72 in the 2000s, a difference equivalent to only 9.5 runs per team innings.
So why did the 1930s provide more instances of massive team innings, yet almost-identical overall averages and median scores? The likely answer is that the benefits when batting on dry pitches, were balanced out by also playing on rain-affected ones.
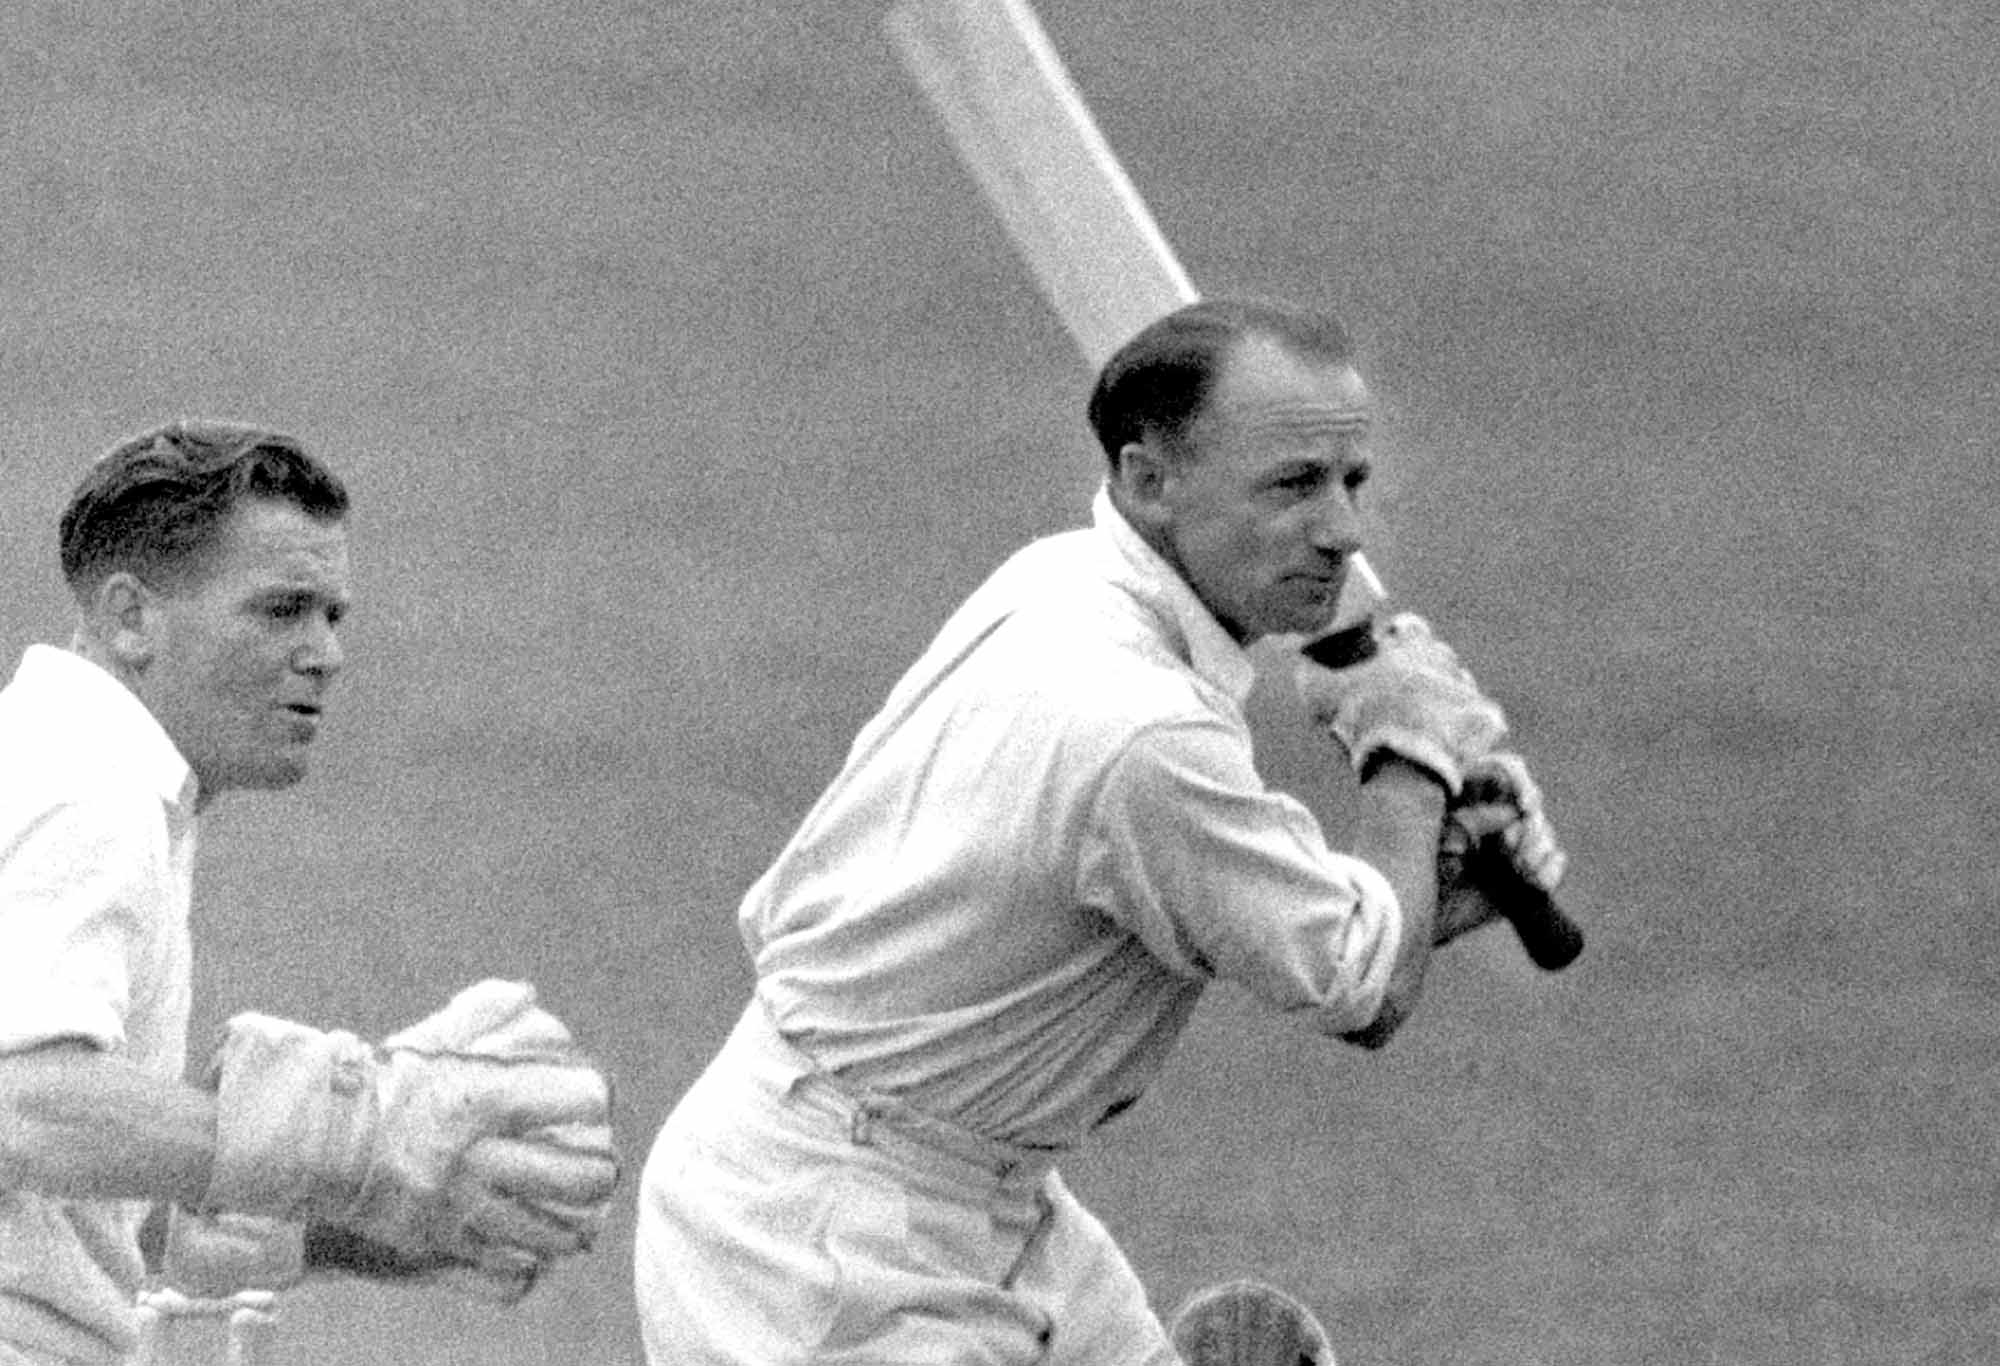
Sir Donald Bradman. (PA Images via Getty Images)
In the 1930s, along with seven instances of a team scoring 600 runs, there were also 10 of a team being dismissed below 150. Whereas in the 2000s, while a team scored 600 on just three occasions, there were only four instances of one being dismissed below 150.
The 1938 series is a perfect example of its decade’s ‘rocks or diamonds’ nature. While England did score 7(dec)903 at The Oval and 8(dec)658 at Trent Bridge, six of the series’ other 12 innings were modest- 5/107, 123, 123, 201, 223 and 242. Conversely, while the 2006/07 series featured 5 team totals under 200, it also yielded four large ones- 602, 6(dec)551, 5(dec)527 and 513.
Scoring rates also give an indication of conditions. They averaged 2.66 runs per over during the 1930s, and 3.62 in the 2000s. The latter decade’s rate was 36 per cent higher.
Another measure is boundary frequency. During the 1930s, 37.8 per cent of all runs were scored in boundaries. In the 2000s, the figure was a far-higher 53.7 per cent. While Bradman’s career scoring rate was an impressive 61-62 runs per 100 balls, he hit only six sixes. By comparison Jacques Kallis struck 97 of them in accruing fewer than twice as many runs, and despite a far more pedestrian scoring rate of 45.97.
Individual innings
While the 1930s boasted 24 innings in excess of 150 runs, the 2000s featured 18. And while the 1930s’ median score for all centuries was 153, the corresponding 2000s figure was 133.
But paradoxically, the 1930s featured fewer centuries and half-centuries in total, than did the 2000s. The 1930s also featured a lower proportion of players with batting averages over 50 (and over 40, and over 30).
Additionally, 18 of the 20 fastest-scoring batters across both decades, were from the 2000s (qualification 5 games). Bradman (fifth) and Stan McCabe (eighth) were the only 1930s batsmen to make that list.
Clearly when batting conditions were good in the 1930s, they were very good. Add in high over-rates and often-timeless matches, and it is understandable that batsmen with the capacity to bat for long periods, sought to make the most of every dry pitch that they encountered.
By the 2000s, in contrast, batters were executing a ‘crash through or crash’ strategy. It was influenced by white-ball tactics and better suited to shorter Tests, power bats, protective equipment, closer boundaries and faster outfields, and a complete absence of rain-affected pitches.

Ricky Ponting in 2005. (Photo by Hamish Blair/Getty Images)
Were Bradman’s performances really so unusual?
While some may consider Bradman’s average of 99.94 artificially enhanced, it’s worth listing others who, like him, scored heavily over 80 consecutive innings. They include Steve Smith (78.68), Ricky Ponting (75.40), Garry Sobers (73.07) and Jacques Kallis (71.38). Andy Flower (91.20 over 34 consecutive innings) also enjoyed a golden run.
Similarly, prolific debutants have included Adam Voges (97.46 after his first 19 innings), Jimmy Adams (86.40 after 21), Michael Hussey (86.18 after 29), Herbert Sutcliffe (82.60 after 23), Neil Harvey (79.25 after 20), Wally Hammond (75.47 after 19) and Doug Walters (74.17 after 26). But again, unlike Bradman, none could sustain their peaks over an entire career.
It has been suggested that Bradman padded his average with ‘meaningless’ runs. And his batting average for his 29 three-figure scores is an impressive 234.47, assisted by six of them being not-out, and 12 in excess of 200.
However everything’s relative, and 88 players have higher batting averages for their three-figure innings. They include the 2000s’ Andy Flower (340.00), Shivnarine Chanderpaul (319.83), VVS Laxman (274.77), Steve Waugh (255.41), Ross Taylor (248.09) and AB de Villiers (244.00). Even McCabe (251.50) and Victor Trumper (237.80) benefitted more than Bradman, from the effects of red-inks and big hundreds on their career averages.
Occasional periods of sub-par performances are inevitable in any long career. Mark Waugh, Greg Chappell and Denis Compton experienced them, among many others.
Bradman also struggled at times, notably on rain-affected pitches and against Bodyline. He openly disdained both challenges, refusing to modify his technique for the former, and electing to counter-attack riskily against the latter.
However ‘sticky’ pitches disappeared 70 years ago, and Bodyline was a brief anomaly created specifically to subdue Bradman. Excluding his innings in those rare circumstances, would effectively increase his average from 99.94, to above 113.
Yes, Bradman is a genuine outlier
So were Bradman’s figures enhanced by frequently batting in perfect conditions? Or did he single-handedly skew the 1930s’ overall statistics, that would otherwise have been underwhelming by comparison with those of subsequent decades?
While the 2000s featured 53 centuries in Ashes matches, the 1930s included just 39 if Bradman’s 13 are excluded. And while the 2000s boasted 18 individual scores of 150 or more, the 1930s featured just 16 of them if Bradman’s eight are disregarded. To further underline his impact on the 1930s’ overall statistics, he also scored seven of that decade’s 14 Ashes double-centuries, five of the six made in all Tests played in Australia, and 10 of the 28 recorded world-wide.
The median score for Ashes centuries during the 1930s may have been 153, by comparison with a lower figure of 133 for the 2000s. But if Bradman’s centuries are excluded, then his decade’s median also becomes 133.
Replacing Bradman’s notional 200 runs per match with a lesser batsman’s 70, reduces that game’s run aggregate by 130, and its average per wicket by more than three runs, to a below-par 32. That’s a lower figure than the corresponding ones for the 1960s, 1980s, 2000s and 2010s.
If 100 runs are deducted from each of his 12 innings in excess of 200, he still boasts a career average of 82.80. That’s 35 per cent higher than has ever been achieved by another batsman.
And if 100 runs are deducted from each of his 29 three-figure scores (ie 2,900 runs from his career aggregate), he still averages 58.51. The same exercise reduces Sachin Tendulkar’s career average to 36.56, and that of Ricky Ponting to 35.96.
His career average of 99.94 is 63 per cent higher than that of any other batsman in history. His feats of scoring a century in 36 per cent of his innings, and reaching 50 runs in 52 per cent, are unmatched. He also reached 25 runs more frequently than any other batsman, and double figures more often than anyone except Jack Hobbs and Herbert Sutcliffe (qualifications 40 innings). And his average of 165 balls faced per dismissal, is the highest of all time.
It is sometimes suggested that Bradman’s dominance, rather than making life easier for those who batted with and after him, instead repressed those team-mates’ run-scoring. However there is only one instance of him twice failing in a match, and his team-mates scoring the runs necessary for Australia to win – or even to draw- that game. At Trent Bridge in 1934, when Australia won by 238 runs, he contributed a modest 25 and 29.
If Bradman’s career average is considered equivalent to only 70-80 in the modern era, then arguably those of his peers should be adjusted proportionately. The likes of Bill Ponsford and McCabe would average in the mid-30s, rather than high-40s. And leading English bowlers Harold Larwood, Bill Voce, Ken Farnes and Hedley Verity would average below 22, rather than in the high-20s.

Sachin Tendulkar. (Photo by Cameron Spencer/Getty Images)
Conclusion
I’ll finish by answering the two questions that I posed at the beginning of this article.
Firstly, I propose that Bradman would have been just as successful in the 2000s, and possibly more so. He was simply more efficient than any player before or since, in scoring as many runs as possible, as quickly as possible. His combination of ability, technique and temperament was unique.
The shorter duration of modern Tests might reduce the frequency of his double-centuries. However his average might well rise, due to playing in more controlled and unvarying conditions, and by recording more not-outs.
And his scoring rate might also increase, helped by the previously-described developments unavailable to him 70 years previously. After all, not only did the 2000s produce as many runs overall as the 1930s, it did so with a scoring rate 36 per cent higher.
Secondly, it’s difficult to imagine any modern batter preferring the 1930s. In return for increased opportunities to make big hundreds, one would also have to accept batting regularly on a rain-affected pitch. As well as playing every innings without a power bat, and protective equipment, and the many other aids that every 21st-century player takes for granted.
Yes, Bradman made hay while the sun shone. But the sun shines during every era.
All day Roseville all dayhttps://https://ift.tt/l3QAO4W hay while the sun shines: Why The Don would average over 100 if he played in modern era
Post a Comment